 |
| pic 1 |
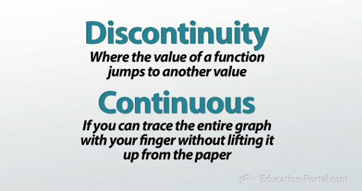 |
| pic 2
Citation:
pic1: http://www.necessaryconclusions.com/2008/10/02/continuity-and-discontinuity/
pic2: http://education-portal.com/academy/lesson/discontinuities-in-functions-and-graphs.html
2. A limit is a the intended height that a graph or function wants to reach. A limit exists because a graph tends to reach a certain height but never reaches it and it exists as long as you reach the same place from both the left and the right. Limits don't exist when the left and right behavior don't match, unbounded behavior, and the graph contains oscillating behavior. A limit as stated before is an intended value that the function want to reach but doesn't while a value is the actual height that the function reaches.
 Pic3: Limit behavior matches from left to right Pic3: Limit behavior matches from left to right
Citation:
pic3: http://www.calculus-help.com/tutorials 3. We evaluate limits numerically, algebraically, and graphically. Numerically meaning we use the method of making a table and finding the limits of each of the values of x approaching the value given approaching x from the left and from the right. When plotting these numbers on a table you basically plug it into the calculator and trace to find the limits of each. Finding limits algebraically is also very simple, all you need to do is use the three last methods explained: direct substitution, dividing out/factoring method, and lastly rationalizing/conjugate method. Out of all these forms, graphically is the on that is the most simple because all you need to do is basically look at the graphs and determine where all the limits lie of each values and determine if they do exist by using your fingers or simply just taking a look at it. |

No comments:
Post a Comment