The post is a letter to a Math Analysis Honors student in my class next year.
1. What do you want to say to them to help them have the most successful year possible?
Math analysis is very rigorous course in terms that you have to stay on top of things. This class requires you to stay organized, manage your time, and work hard in order to succeed. I know it may seem quite overwhelming in the beginning of the year but honestly it is a very great class to take in order to challenge your management. To have the most successful year I believe that you just must stay on top of your things and get things done on time. If not then you will catch yourself falling behind and not being able to catch back up. It is important that all of you taking this class are prepare for the work load and for the many requirements entailed to pass this class such as the Internet. This class requires you to use your resources like the computer a lot and just everything given to you by Mrs. Kirch herself. It is important mainly as I said before that you remain organized and up to date. Also, and important factor for success is to work hard. You need to be able to put in the work in this class in order to succeed. It won't come to you unless you put in the effort. This is necessary for the entire year, even towards the end when you start getting lazy. Working had and staying on top of things are two of the most important factors that you need to possess for success.
2. How can they best adjust to the flipped classroom and learn to work with all the technology I require of them? (do you have any specific tips for them or experiences you could share?)
Adjusting to the flipped classroom the first few weeks are pretty challenging and difficult but as soon as the year progresses you forget about it. At first I had trouble adjusting to the whole learning at home part but after a while you start to notice how much it actually benefits you because in class you get to ask questions. To adjust to the use of technology and flipped classroom just get used to learning at home and getting a quiet place at home where you can study and complete your online lessons. Also you need to come in knowing how to work the computer and have technology such as the graphing calculator.
3. What can they expect to be different from their previous math classes?
The flipped classroom is nothing like what you may expect from your normal math classes. This is a class where you are challenged by your knowledge in technology, and also your capability of staying focused. This classroom requires you to stay on top of things and not fall behind as you can in other math classes. The work load is also different and the responsibility you take on in this course is also much greater. Responsibility I feel is a factor that is much more entailed for this course because you need to be able manage your time and stay focused, even with all the technology that may distract you.
Thursday, June 6, 2013

Monday, June 3, 2013
Unit V BlG Question Blog Post
Unit V BlG Question Blog Post
1. Explain in detail where the difference quotient comes from.
The difference quotient is derived from a graph in which we are trying to figure out the slope of the tangent line. This slope that we are trying to find of this tangent line is also known as the derivative which is usually shown as f' (x). The difference quotient comes from the point on the graph in which the slope of the tangent line is crossing at. This point is referred to as (x, f(x)). The change of x where another tangent line crosses the graph is known as the change of x (delta x+ x) plus x. The secant line is the place where the line crosses at two points which also helps explain this difference quotient where the second ordered pair is known as (x+deltax, f(x+delta x). After getting these two points you use the slope formula of y2-y1/x2-x1 in order to solve further. When plugging in the values of the ordered pairs you are able to cancel some values and are then left with the difference quotient.
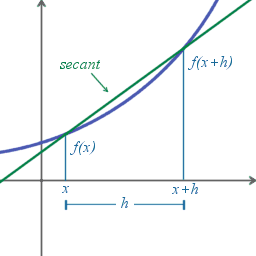
1. Explain in detail where the difference quotient comes from.
The difference quotient is derived from a graph in which we are trying to figure out the slope of the tangent line. This slope that we are trying to find of this tangent line is also known as the derivative which is usually shown as f' (x). The difference quotient comes from the point on the graph in which the slope of the tangent line is crossing at. This point is referred to as (x, f(x)). The change of x where another tangent line crosses the graph is known as the change of x (delta x+ x) plus x. The secant line is the place where the line crosses at two points which also helps explain this difference quotient where the second ordered pair is known as (x+deltax, f(x+delta x). After getting these two points you use the slope formula of y2-y1/x2-x1 in order to solve further. When plugging in the values of the ordered pairs you are able to cancel some values and are then left with the difference quotient.
Citation: http://upload.wikimedia.org/wikipedia/commons/8/8c/Derivative.png
Monday, May 27, 2013
Unit U Blog Post
Unit U Big Questions:
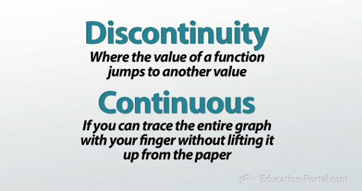
1. Continuity is the state of something being continuous in terms of this unit it has to do with the continuous functions on the graphs that can be drawn without a break between a pencil stroke. Discontinuity is the opposite, this describes a function on the graph which has breaks and cannot be drawn with one stroke of a pencil. On these type of graphs the values jump.
 |
| pic 1 |
 |
| pic 2
Citation:
pic1: http://www.necessaryconclusions.com/2008/10/02/continuity-and-discontinuity/
pic2: http://education-portal.com/academy/lesson/discontinuities-in-functions-and-graphs.html
2. A limit is a the intended height that a graph or function wants to reach. A limit exists because a graph tends to reach a certain height but never reaches it and it exists as long as you reach the same place from both the left and the right. Limits don't exist when the left and right behavior don't match, unbounded behavior, and the graph contains oscillating behavior. A limit as stated before is an intended value that the function want to reach but doesn't while a value is the actual height that the function reaches.
 Pic3: Limit behavior matches from left to right Pic3: Limit behavior matches from left to right
Citation:
pic3: http://www.calculus-help.com/tutorials 3. We evaluate limits numerically, algebraically, and graphically. Numerically meaning we use the method of making a table and finding the limits of each of the values of x approaching the value given approaching x from the left and from the right. When plotting these numbers on a table you basically plug it into the calculator and trace to find the limits of each. Finding limits algebraically is also very simple, all you need to do is use the three last methods explained: direct substitution, dividing out/factoring method, and lastly rationalizing/conjugate method. Out of all these forms, graphically is the on that is the most simple because all you need to do is basically look at the graphs and determine where all the limits lie of each values and determine if they do exist by using your fingers or simply just taking a look at it. |
Wednesday, April 24, 2013
Big Question Blog Post Unit T Question 2
Question:
2. How do the graphs of sine and cosine relate to each of the others?
a. tangent?
b. cotangent?
c. secant?
d. cosecant?
Explanation:
a. The sine and cosine graphs explained in the first concept relate to the tangent graphs by them dealing with writing the domain the same way and following almost the same process to finding the period shifts and the rest. The difference now is that we are dealing with figuring out the asymptotes in the graph due to the ratio of sin/cos where cosine for tangent at times will equal zero to give you an undefined answer which will lead you to having to draw asymptotes.
b. For Cotangent graphs it is the same as tangent graphs except now the difference is that the ratio of a cotangent graph is different meaning the asymptotes will change. Now, the ratio is cos/sin where now sin becomes the one that is equal to zero at some point with the reference points meaning that asymptotes will have to be drawn and solved for.
c. The sine and cosine graphs are similar to the secant graphs in the sense that the secant graph follows the same process when you do cosine graphs except now you have to worry about asymptotes. Being that one of the values of the ratio of secant has a denominator of zero allows you to recognize that there will be use of an asymptote. Asymptotes are use when you get an undefined answer and this is shown through secants ratio which is r/x where at one point x is equal to zero making the solution undefined because r always equals 1. So when drawing these asymptotes and labeling them on our graph we have to take a look at it and draw our parabolas that lie between these asymptotes. Also it can be explained as secant equalling 1/cos, where at one point cosine in that function will equal zero meaning that a asymptote will appear.
d. As far as cosecant goes it also follows the same process as a sine graph yet now we are dealing with the ratio of r/y where y at one point is equal to zero. The denominator can never be zero but at one point with the given reference angle ordered pairs it is clear that the denominator (or x) will be zero which will give you an answer that is undefined. As stated before these undefined solutions allow you to plot the asymptotes and change the way the graphs are made because it now becomes a u shape (parabola). This one can also be explained as cosecant equalling the ratio of 1/sin. it is evident that sin will have to equal zero at one point which will make an asymptote appear.
2. How do the graphs of sine and cosine relate to each of the others?
a. tangent?
b. cotangent?
c. secant?
d. cosecant?
Explanation:
a. The sine and cosine graphs explained in the first concept relate to the tangent graphs by them dealing with writing the domain the same way and following almost the same process to finding the period shifts and the rest. The difference now is that we are dealing with figuring out the asymptotes in the graph due to the ratio of sin/cos where cosine for tangent at times will equal zero to give you an undefined answer which will lead you to having to draw asymptotes.
b. For Cotangent graphs it is the same as tangent graphs except now the difference is that the ratio of a cotangent graph is different meaning the asymptotes will change. Now, the ratio is cos/sin where now sin becomes the one that is equal to zero at some point with the reference points meaning that asymptotes will have to be drawn and solved for.
c. The sine and cosine graphs are similar to the secant graphs in the sense that the secant graph follows the same process when you do cosine graphs except now you have to worry about asymptotes. Being that one of the values of the ratio of secant has a denominator of zero allows you to recognize that there will be use of an asymptote. Asymptotes are use when you get an undefined answer and this is shown through secants ratio which is r/x where at one point x is equal to zero making the solution undefined because r always equals 1. So when drawing these asymptotes and labeling them on our graph we have to take a look at it and draw our parabolas that lie between these asymptotes. Also it can be explained as secant equalling 1/cos, where at one point cosine in that function will equal zero meaning that a asymptote will appear.
d. As far as cosecant goes it also follows the same process as a sine graph yet now we are dealing with the ratio of r/y where y at one point is equal to zero. The denominator can never be zero but at one point with the given reference angle ordered pairs it is clear that the denominator (or x) will be zero which will give you an answer that is undefined. As stated before these undefined solutions allow you to plot the asymptotes and change the way the graphs are made because it now becomes a u shape (parabola). This one can also be explained as cosecant equalling the ratio of 1/sin. it is evident that sin will have to equal zero at one point which will make an asymptote appear.
Tuesday, April 23, 2013
Big Post Blog Questions Unit T Question 4
Question 4:
Why do sine and cosine NOT have asymptotes, but the other four trig functions do?
Explanation:
Sine and cosine do not have asymptotes because as we know from previous units sine is equal to the ratio y over r and we know that r is always equal to 1 so with this knowledge it is easy to see how each ordered pair from each unit does not end up equalling undefined. From the points on the unit circle at each reference angle: (1,0), (0,1), (-1,0), (0,-1) if we plug in each of the y values into the ratio that is equal to sine we get real numbers such as 1, -1, and zero. When we plug in each of these values there are no equations that leave us with an answer as undefined such as tangent and cotangent do. As for cosine, it follows the same process when proving that there are no asymptotes but instead now the ratio we use is x over r where r still has the value of 1. When plugging in each of the ordered pairs x values it is evident that there are no undefined answers and just like sine your answers are either: 1,-1, or 0. There aren't any instances where the denominator is zero in when using these two ratios for sine and cosine. By noticing this we know that there will be no undefined answers meaning there will also be no asymptotes. As for the other four trig functions such as cotangent and tangent it is clear to see how there ratios (x/y and y/x) allow them to have an asymptote. They have an asymptote when the denominator of their ratio is equal to zero. Same goes for cosecant and secant graphs.


Why do sine and cosine NOT have asymptotes, but the other four trig functions do?
Explanation:
Sine and cosine do not have asymptotes because as we know from previous units sine is equal to the ratio y over r and we know that r is always equal to 1 so with this knowledge it is easy to see how each ordered pair from each unit does not end up equalling undefined. From the points on the unit circle at each reference angle: (1,0), (0,1), (-1,0), (0,-1) if we plug in each of the y values into the ratio that is equal to sine we get real numbers such as 1, -1, and zero. When we plug in each of these values there are no equations that leave us with an answer as undefined such as tangent and cotangent do. As for cosine, it follows the same process when proving that there are no asymptotes but instead now the ratio we use is x over r where r still has the value of 1. When plugging in each of the ordered pairs x values it is evident that there are no undefined answers and just like sine your answers are either: 1,-1, or 0. There aren't any instances where the denominator is zero in when using these two ratios for sine and cosine. By noticing this we know that there will be no undefined answers meaning there will also be no asymptotes. As for the other four trig functions such as cotangent and tangent it is clear to see how there ratios (x/y and y/x) allow them to have an asymptote. They have an asymptote when the denominator of their ratio is equal to zero. Same goes for cosecant and secant graphs.


Big Question Blog Posts Unit T Question 3
Question 3:
Why is a "normal" tangent graph uphill, but a "normal" cotangent graph downhill?
Explanation:
This question can be explained by basically telling that the asymptotes of cotangent and tangent graphs differ in movement. They are divided separately because the signs of tangent don't start repeating their pattern until they go through each quadrant while cotangent just goes through the first two quadrants and its pattern repeats. By these two picture it is easily shown the difference, there are more asymptotes for a tangent graph than a cotangent graph due to the ratios use and their solutions of getting undefined. The ratios such as sin/cos=tan and cos/sin=cot are what seem to determine these asymptotes because the denominator cannot equal zero. The asymptotes and where they are drawn are basically what determines the difference in the movement of these two graphs. As seen in the picture for the cotangent graph there is an asymptote starting at 0 and another one at pi while tangent has its first asymptote starting at pi/2 which means that the curve lands in the first quadrant which is positive meaning that the line is going uphill but then when it goes into the second quadrant tangent is negative in the second quadrant which makes sense that the graph go downward but upward again in the third quadrant.
Citations:
Picture 1:
http://aventalearning.com/content168staging/2008Trigonometry/unit4/images/MTH08-68.20159.jpg
Picture Cot:
http://www.drdelmath.com/slu_precalculus/trig_images/trig_graph_cotangent.gif
Why is a "normal" tangent graph uphill, but a "normal" cotangent graph downhill?
Explanation:
This question can be explained by basically telling that the asymptotes of cotangent and tangent graphs differ in movement. They are divided separately because the signs of tangent don't start repeating their pattern until they go through each quadrant while cotangent just goes through the first two quadrants and its pattern repeats. By these two picture it is easily shown the difference, there are more asymptotes for a tangent graph than a cotangent graph due to the ratios use and their solutions of getting undefined. The ratios such as sin/cos=tan and cos/sin=cot are what seem to determine these asymptotes because the denominator cannot equal zero. The asymptotes and where they are drawn are basically what determines the difference in the movement of these two graphs. As seen in the picture for the cotangent graph there is an asymptote starting at 0 and another one at pi while tangent has its first asymptote starting at pi/2 which means that the curve lands in the first quadrant which is positive meaning that the line is going uphill but then when it goes into the second quadrant tangent is negative in the second quadrant which makes sense that the graph go downward but upward again in the third quadrant.
 |
| Asymptote for cotangent graph |
 |
| Asymptotes for tangent graph |
Citations:
Picture 1:
http://aventalearning.com/content168staging/2008Trigonometry/unit4/images/MTH08-68.20159.jpg
Picture Cot:
http://www.drdelmath.com/slu_precalculus/trig_images/trig_graph_cotangent.gif
Big Questions Blog Post Unit T
Question
1. How do the trig graphs relate to the Unit Circle?
a. period?- why is the period for sine and cosine 2pi, whereas the period for tangent and cotangent is pi?
b. How does the fact that sine and cosine have amplitudes of one (and other trig functions don't have an amplitude) relate to what we know about the Unit Circle?
Answers:
1. The trig graphs relate to the unit circle by them following the same repetitive patter when going in a circle yet not it is shown as a line on the x axis. For example, for the trig graphs the quadrants used in the unit circle are now drawn on a line rather than a circle where the sign changes for each different trig function still remains the same.


1. How do the trig graphs relate to the Unit Circle?
a. period?- why is the period for sine and cosine 2pi, whereas the period for tangent and cotangent is pi?
b. How does the fact that sine and cosine have amplitudes of one (and other trig functions don't have an amplitude) relate to what we know about the Unit Circle?
Answers:
1. The trig graphs relate to the unit circle by them following the same repetitive patter when going in a circle yet not it is shown as a line on the x axis. For example, for the trig graphs the quadrants used in the unit circle are now drawn on a line rather than a circle where the sign changes for each different trig function still remains the same.

In this picture you can see how the renewed unit circle looks and how familiar it looks to the actual circle by containing the three major points (90, 180, 270, and 360) all on this axis which does not lose its significance when figuring out the signs of each trig function. The signs remain the same as when we figured them out using ASTC, if we even wanted to we could still write ASTC on it and still be able to use it.
a. The period relates to the unit circle because one revolution around the unit circle is basically one cycle in which it takes for the pattern of signs and everything to repeat itself. So just like a period on these graphs it shows or lets us know how long it takes the trig function to go through one cycle. The period for sine and cosine are 2pi because thats how long it takes to go through one time of their cycle for it to then repeat itself again. They cover 2pi units on the x axis before repeating themselves all over. This picture shows just that, the pattern from 2pi repeating over again once going through a cycle.

As for cotangent and tangent the period is pi because again that is how long of a cycle it takes for one cycle, before the pattern of these two repeat itself. They have to cover pi units in order to start repeating there cycle once again.

b. The trig graphs relate to the amplitudes by them dealing with the numbers dealing with the coefficient that is connected with the trig function. The fact that sine and cosine have amplitudes relate to what we know about the unit circle because on the unit circle we are familiar that at each reference angle 0, 90, 180 and 270, they have points connected to them and when looking at the points at 0 is (0,1) and at 180 its (0,-1). These two points on the graph simply show how sine is 1 because it starts at 1 and ends at 1 for one cycle on the Unit Circle. As for cosine this is evident through the points at 90 and 270 where 90 has the points (1,0) and 270 has the points (-1,0), through this knowledge from the unit circle it is easy to see how both cosine and sine have amplitudes of one because it is dealing with the ordered pairs and the cycle needed for one of the trig functions. The other trig functions can also be explained to have no amplitude because if you think about it for tangent you would either be getting undefined or 0 as the amplitude, same goes for cotangent.
Citations
Picture 1:
http://mathbits.com/MathBits/StudentResources/GraphPaper/trigsmaller.jpg
Picture 2:
http://img.sparknotes.com/figures/A/ad79275cb59e569b790cb945a4ffc553/quadrantgraph.gif
Picture 3:
http://www.s-cool.co.uk/a-level/assets/learn_its/alevel/maths/trigonometry/graphs-of-trigonometric-functions/2007-10-09_133331.gif
Picture 4:
http://www.calculatorsoup.com/images/trig_plots/graph_cot_pi.gif
Subscribe to:
Posts (Atom)